Using Analytics (Data) To Grow Your Creative Brand: A Step-by-Step Guide
A practical playbook for artists, musicians, designers, and creators to turn numbers into growth, fans, and revenue.
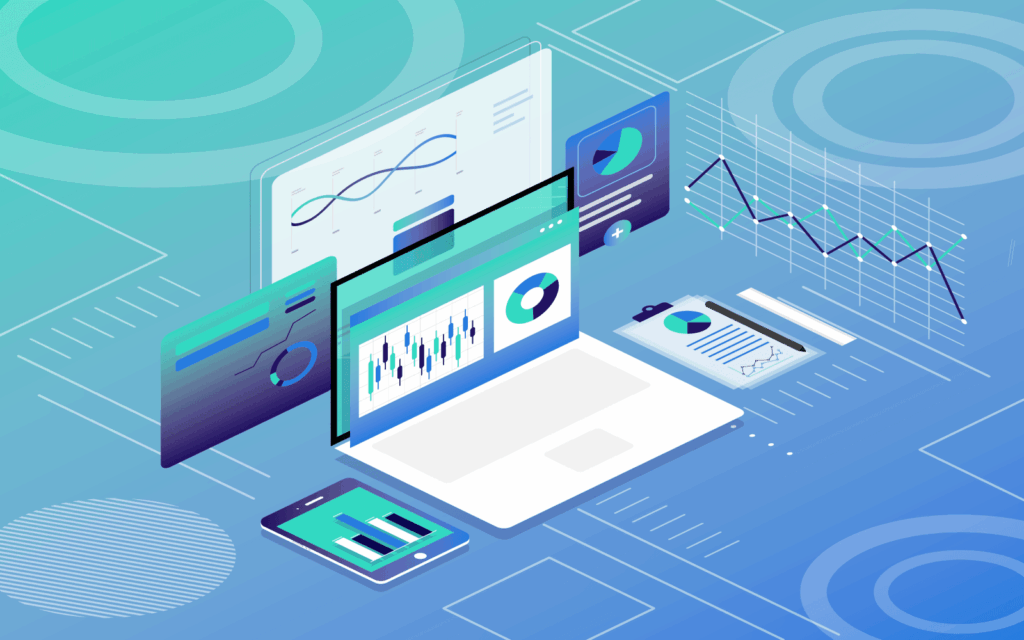
Introduction
What you’ll learn
- Core tools for web, social, streaming, and e-commerce analytics
- Which metrics to track—and why they matter
- How to analyze trends and optimize your content & campaigns
1) Analytics Basics for Creatives
What is analytics?
Collecting and interpreting data to understand patterns and make better decisions. For creatives, this includes social insights, website traffic, sales, and streaming performance.
Why data is essential
- See what content resonates with your audience
- Identify your most effective marketing channels
- Streamline your workflow and prioritize high-impact work
- Measure the outcomes of your creative efforts over time
Types of data to track
- Website: traffic, bounce rate, conversions
- Social: engagement, reach, follower growth
- Sales: revenue, AOV, product performance
- Streaming: plays, completion, listener demographics
2) Set Up the Right Tools
Website: Google Analytics
What it does: Tracks traffic, user behavior, and conversions so you can see how visitors engage with your site/portfolio.
- Page Views: Total views of each page
- Bounce Rate: % leaving after one page—aim to lower
- Conversion Rate: % who take key actions (signup, purchase)
Social: Built-in Insights
What they do: Instagram, YouTube, Facebook, TikTok, X all show post and audience performance.
- Engagement: likes, comments, shares, saves
- Reach & Impressions: how many people see your posts
- Follower Growth: net gains by day/week/month
Streaming: Spotify for Artists, Apple Music, SoundCloud
What they do: Show plays, demographics, top markets, and retention so you can plan releases and touring/ads.
- Streams/Plays
- Listener Demographics: age, location, gender
- Engagement: completion and repeat listening
E-commerce: Shopify, WooCommerce, Etsy
What they do: Track sales, top products, and customer behavior to improve offers and pages.
- Sales & Revenue
- Average Order Value (AOV)
- Product Performance
3) Make Sense of the Numbers
Define your success metrics
Choose metrics aligned with your goals (grow fans, sell merch, drive streams). Musicians may focus on plays and saves; visual artists may focus on print/commission sales.
Spot trends & patterns
- Which posts get the most comments/saves?
- Which tracks or products drive the most actions?
- What days/times are your followers most active?
Optimize your content
- Double down on formats that win (shorts/reels, BTS, tutorials, live sets)
- Post when your audience is most active
- Iterate thumbnails, titles, hooks, and CTAs
4) Use Data to Improve Marketing & Promotion
Measure campaign effectiveness
- Track conversion rate for ads, emails, and organic pushes
- Run A/B tests on creatives, headlines, and landing pages
Track ROI
Compare ad spend to revenue or meaningful growth (saves, email subs, purchases). Shift budget to top-performing channels.
Optimize your site/landing pages
- Improve speed, clarity, and focus on one primary CTA
- Test layouts, headlines, social proof, and offer bundles
5) Know Your Audience & Build Relationships
Leverage demographics & behavior
Use streaming and social insights to identify top cities, age ranges, and interests. Plan drops, shows, and ads around your strongest markets.
Personalize content
- Location-specific posts/offers for top cities
- Segmented email flows for merch buyers vs. new fans
Targeted campaigns
- Email fans who saved a track with a behind-the-scenes video
- Retarget site visitors with a discount on a related product
6) Track, Refine, Repeat
- Monitor regularly: weekly dashboards for web, social, streaming, and sales
- Adjust quickly: cut what underperforms, scale what wins
- Keep learning: tools evolve—stay curious and iterate
Conclusion
Analytics turn guesswork into strategy. Track the right metrics, learn from your audience, and continuously refine your content and campaigns. That’s how creatives grow sustainably—more fans, more engagement, and more revenue.
